What does one year of quarter-hour prices tell us about the Belgian energy market?
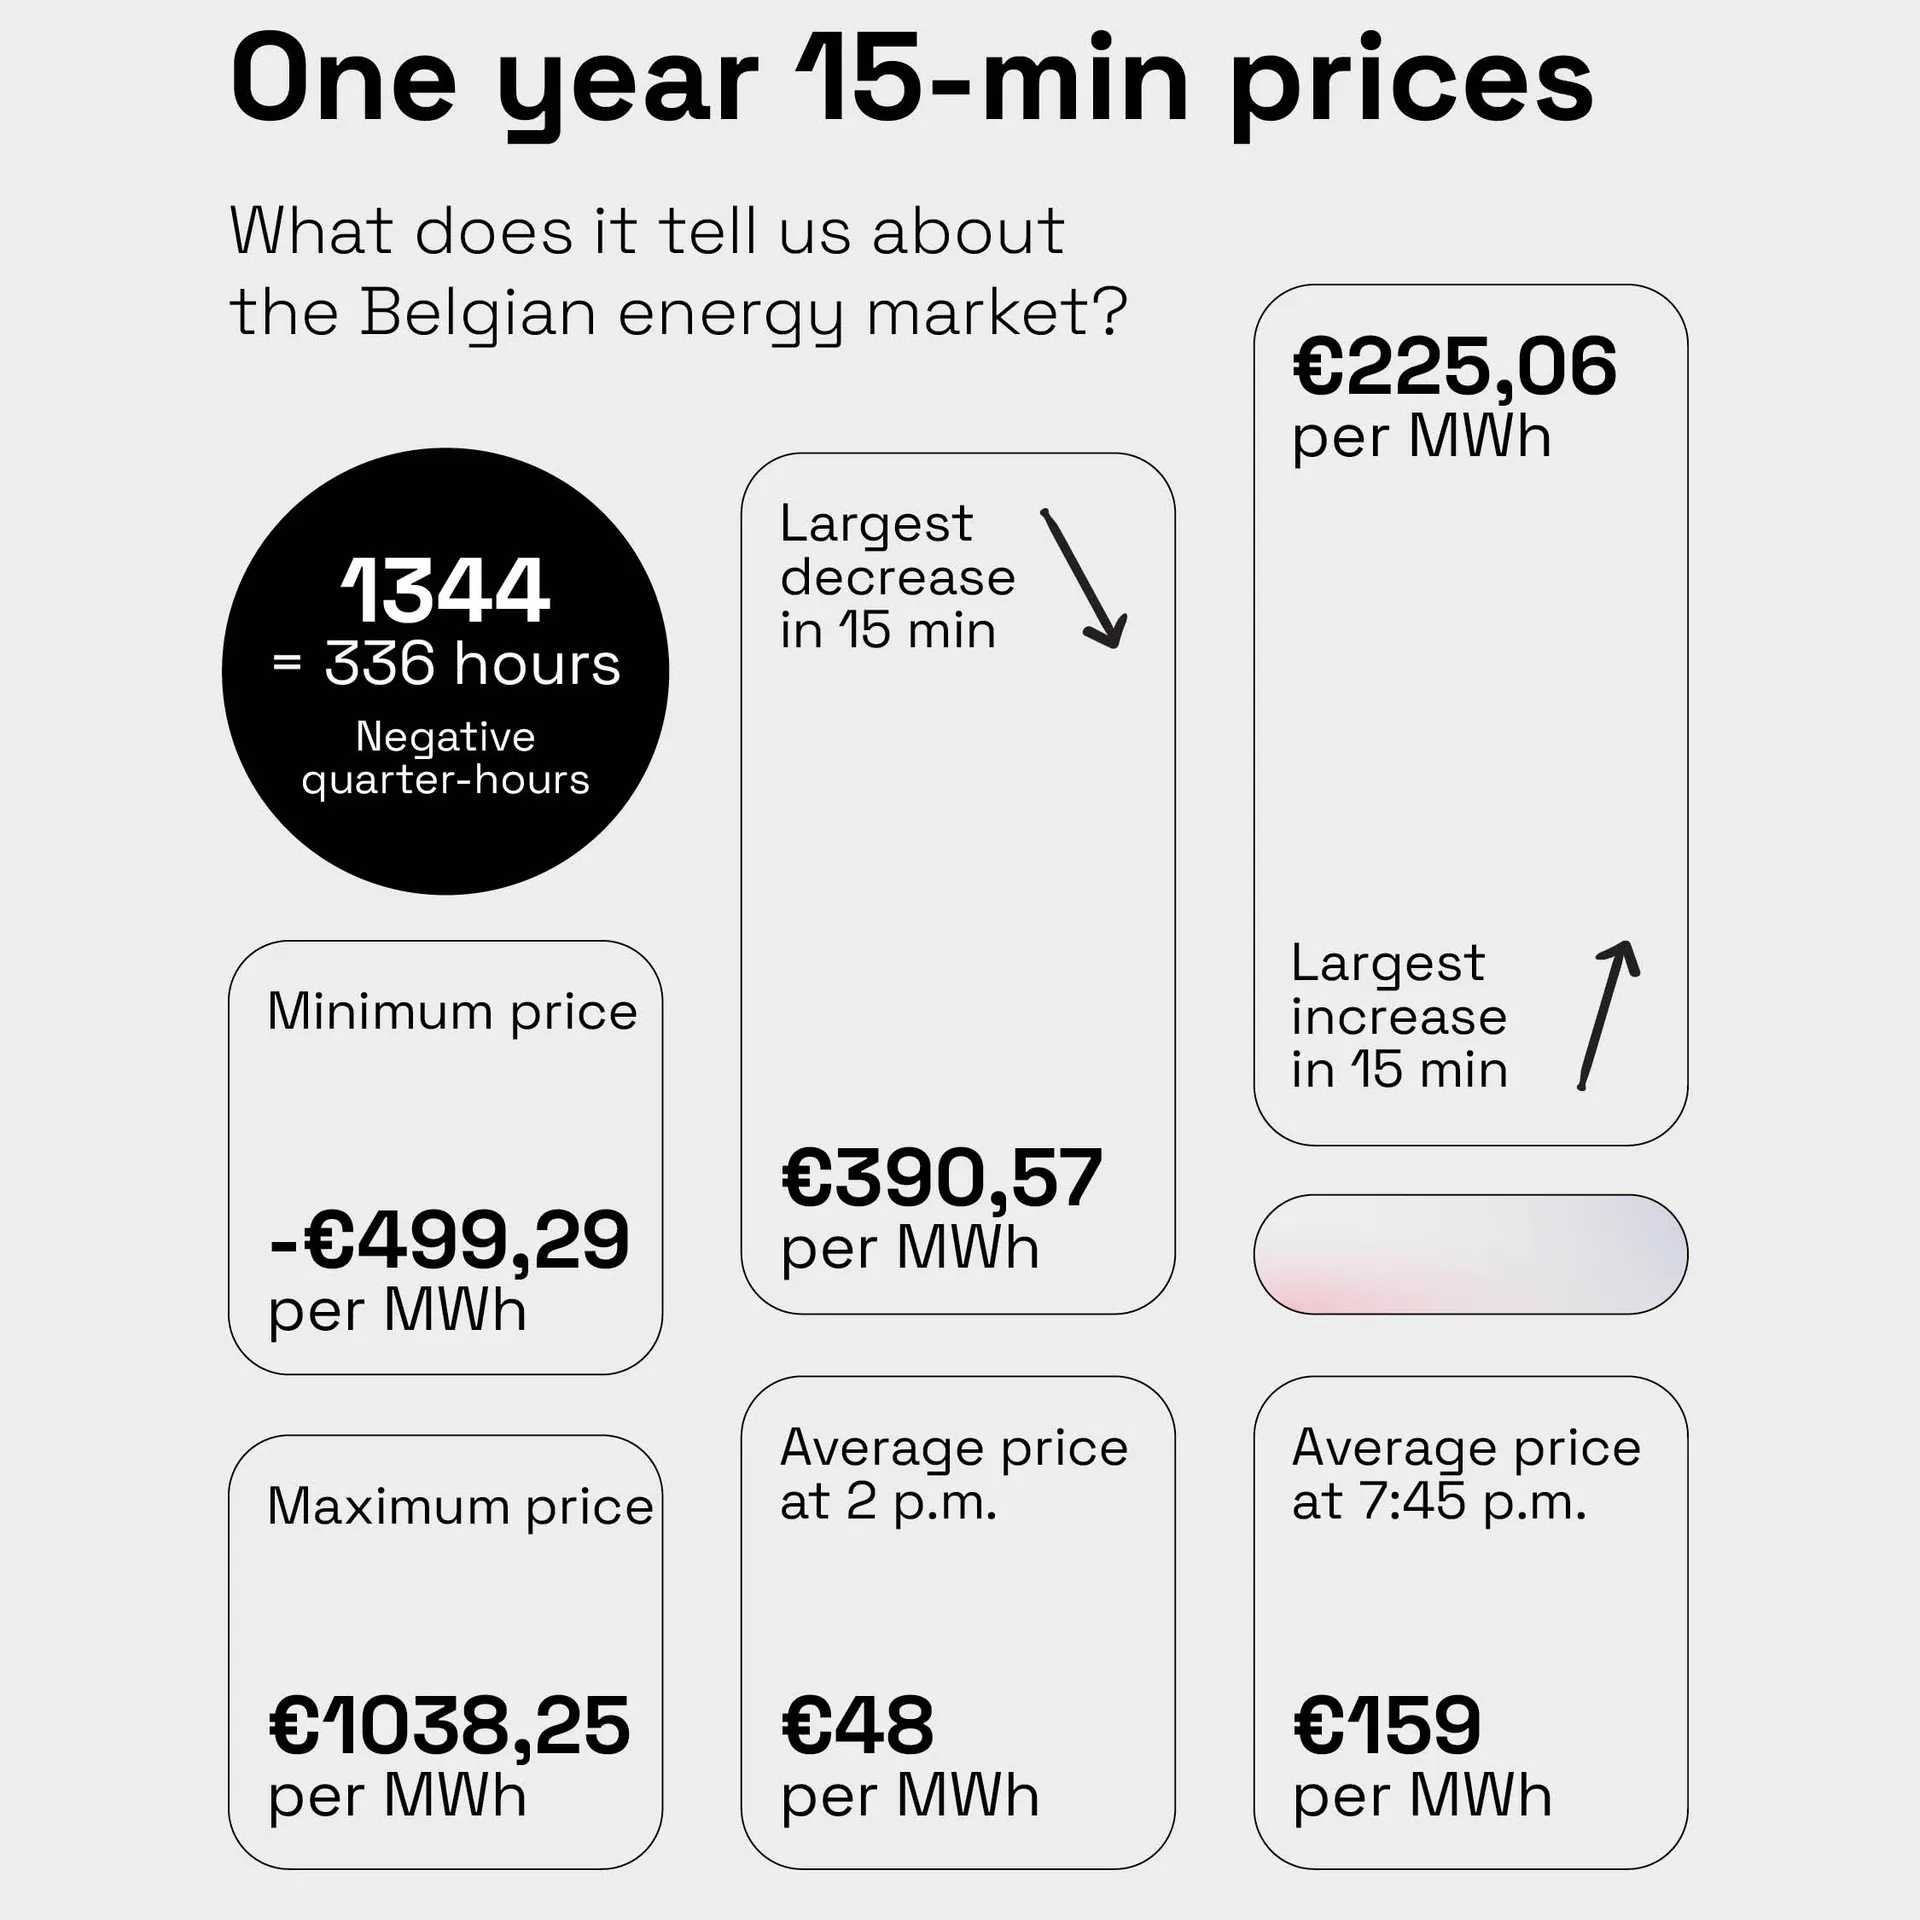
Over the past year, the electricity price was around €48/MWh average at about 2 p.m. At around 7:45 p.m., it was almost €159/MWh. That is a significant gap, and prices can vary considerably even within the same hour. One year of Belgian quarter-hour prices shows how much the timing of consumption or production matters.

From 24 hourly prices to 96 quarter-hour prices
Since October 1, 2025, the European day-ahead market, where electricity is traded for the following day, operates with quarter-hour prices. As a result, a regular day now has 96 prices instead of 24.
We analyzed the 35,040 Belgian quarter-hour prices from the first full year, from October 1, 2025 through September 30, 2026. The analysis shows how large the price differences are, both between days and within the same hour.
The first year in figures
Indicator | Result |
Price level | |
Average price | €100.94/MWh |
Median | €100.00/MWh |
Minimum and maximum | -€499.29/MWh and €1,038.25/MWh |
Extremes | |
Negative quarter-hours | 1,344 (equivalent to 336 hours) |
Quarter-hours at or below zero | 1,527 |
Quarter-hours above €200/MWh | 1,327 |
Quarter-hours above €500/MWh | 31 |
Quarter-hours above €1,000/MWh | 1 |
Quarter-hour to quarter-hour movements | |
Average absolute quarter-hour jump | €9.18/MWh |
Largest increase in 15 minutes | €390.57/MWh |
Largest decrease in 15 minutes | €225.06/MWh |
Spreads* | |
Average intra-hour spread | €23.98/MWh |
Maximum intra-hour spread | €626.44/MWh |
Median daily spread | €138.77/MWh |
Average daily spread | €153.82/MWh |
Source: Strado Group analysis of Belgian day-ahead quarter-hour prices from EPEX SPOT, October 1, 2025 through September 30, 2026.
*A spread is the difference between the highest and the lowest price within an hour or a day. The quarter-hour jump indicates how much the price changes between two consecutive quarter-hours.
Notably, there were almost as many quarter-hours above €200/MWh as quarter-hours with a negative price. Each occurred in roughly 3.8% of all quarter-hours.
Cheap afternoons, expensive evenings
Daily prices follow a recognizable pattern. In the middle of the day, solar panels bring a large amount of electricity to the market. Toward the evening, production drops, while demand for electricity can remain high.
The figures reflect this. Between 2:00 and 2:15 p.m., the average quarter-hour price was around €48/MWh. Between 7:45 and 8:00 p.m., it was almost €159/MWh: more than three times as much.
For companies with a battery or with consumption they can shift, this creates opportunities. Consider a battery that charges during the day and supplies electricity during the evening peak. Or an installation that moves part of its consumption to cheaper moments.
How much this yields depends on the installation, the business activities, and the energy contract. But the price differences make it clear why these opportunities are worth exploring.
Timing also matters within the same hour
The analysis of quarter-hour prices shows that a lot can change within a single hour as well.
The difference between the cheapest and the most expensive quarter-hour within the same hour averaged almost €24/MWh. In 5% of hours, it exceeded €73/MWh, with an outlier of €626.44/MWh on June 24 between 7 and 8 p.m. In addition, nearly a quarter of all quarter-hour prices deviated by more than €10/MWh from the corresponding hourly average.
Negative prices occur mainly on weekends
During the first year we saw 1,344 quarter-hours with a negative price, equivalent to 336 hours in total. More than 70% of them fell on weekends.
This makes sense: many companies use less electricity on weekends, while solar panels keep producing. When supply exceeds demand, the market price can drop below zero.
For a producer, feeding electricity into the grid at such times can cost money. For a company that can draw or store electricity, a negative market price can be attractive.
There were also differences between the seasons. Spring saw the deepest negative prices. Prices fluctuated most in summer, and the most expensive quarter-hour of the year was recorded during the June heat wave: no less than €1,038.25/MWh.
Anyone who only looks at hourly prices does not see how much the price can vary within the same hour. For companies that can control their consumption or a battery, charging a quarter of an hour earlier or later can already make a difference. So, it pays to look at the quarter-hours in which you consume and how much room you have to shift that consumption.

The price floor moved further down
In spring 2026, the market price came close to the then-applicable bottom price of -€500/MWh on several occasions. The bottom price automatically drops by €100 when, within a 30-day period, the price falls below 70% of the then-applicable minimum in multiple market time units on at least two days. Under European rules, the prices for April 26 and May 1, 2026 led to the bottom price being lowered to -€600/MWh. The new bottom price applies from the trading session of May 28, for supply from May 29, 2026.
At -€499.29/MWh, the lowest Belgian quarter-hour of the year was therefore virtually at the old bottom price. At that point, the price could hardly fall any further. Without the bottom price, the production surplus might have pushed the price even lower.
After the bottom price was lowered, the Belgian price did not come near the new limit during the period analyzed. The lowest quarter-hour from May 29 onward was -€52.99/MWh. However, the wider floor does mean that prices could turn even more negative in the future.
What does this mean for your business?
One year of quarter-hour prices makes it clear how important the timing of consumption and production is. That is why it pays to look at where your business can make adjustments. Can certain installations run at a cheaper time? Can you use more of your own solar production? And what role can a battery play in this?
Not every business has the same options. Much depends on your activities, your installations, and your energy contract. A sound approach therefore starts with insight into your own consumption and production. From there, you can determine which adjustments are feasible and where automated control adds value.
Related insights

Energy prices in a volatile market
Your contract, consumption data and flexibility together determine your final energy price.
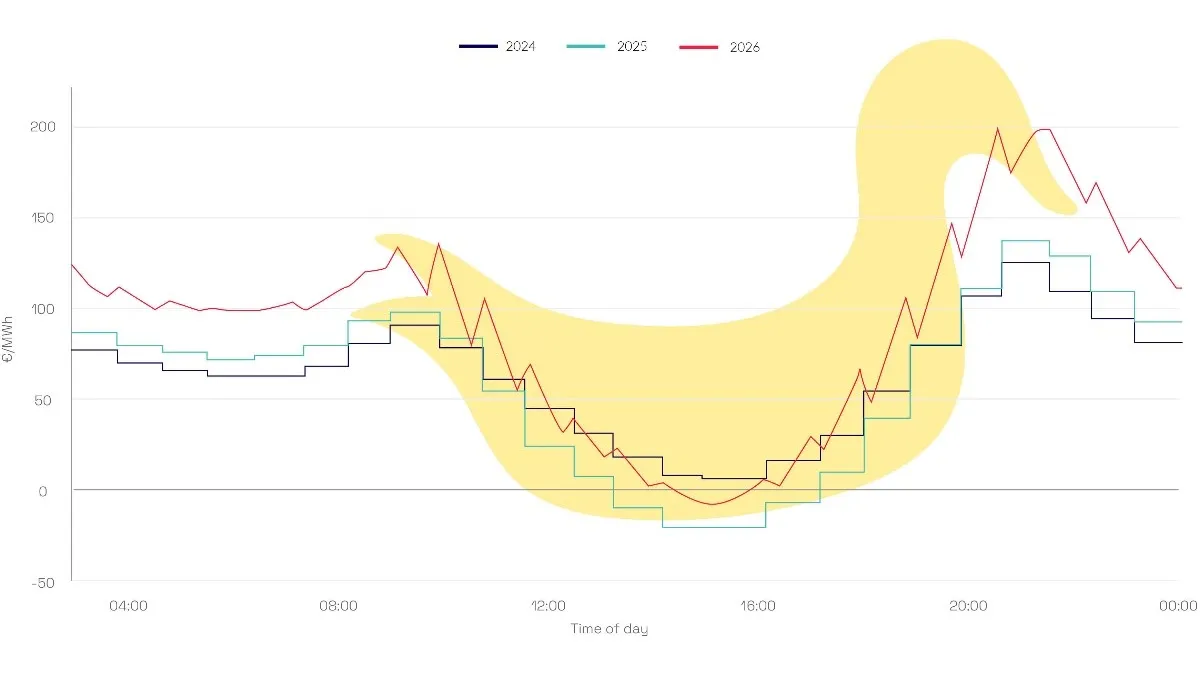
Why the duck curve is shrinking in Australia, while it's getting sharper in Europe
Batteries are flattening the duck curve in Australia and California, while price swings in Europe and Belgium keep growing. Discover why flexibility is becoming increasingly valuable and how your business can take advantage of it today.

Video: How do we keep the electricity grid in balance?
The electricity grid does not stay in balance on its own. Watch how forecasting, flexibility and fast control keep the system in equilibrium.